
Data For Radicals has a great tutorial for making searchable, filterable tables of your data. Here is a clip of the illustrated, step-by-step tutorial, go over to the site for a full version.
Visual approaches to data are great — they can allow us to grasp complex issues at a glance, just the way this map from Clear Health Costs shows us the dramatic differences between what different hospitals charge for the same procedure.
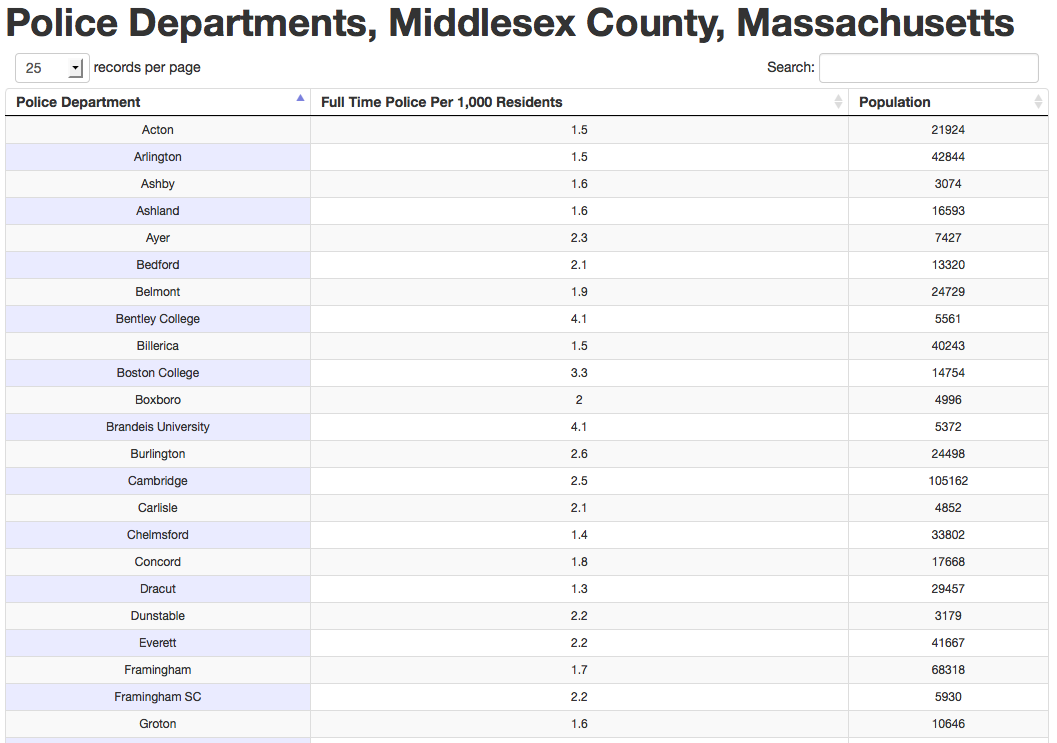
But sometimes a simple, sortable and searchable table of data is all that’s really needed. Using code written by Chris L. Keller, I was able to create this sortable, searchable table of law enforcement agencies in Middlesex County, Massachusetts, along with the populations they serve, and how many full-time officers per capita there are.
As always, click on any image in this blog to see it full size. I leave helpful annotations in the illustrations to these tutorials — so if ya can’t see em, click ‘em!
One of the nice things about this way of presenting data is that even though it’s simple, it can be quite revealing. Click here to go to the live data table and use the up/down arrows to sort by the center column, which displays how many full-time officers per 1,000 people served there are.
7 out of the top ten are colleges and universities. Tiny Lasell College has 7.8 officers per 1,000 students — though with only 1,800 students, their high ratio may have more to do with a minimum number of officers needed to staff three shifts to make sure there are officers on duty 24 hours. But scroll down to the bottom — two of the departments with the lowest ratio are also colleges.
Public colleges.
Surprising? Maybe not, but even so, it was a fact I did not immediately pick out when I downloaded the origincal data from UCRStats.com. And the differences are dramatic; state colleges have among the lowest number of full time officers per 1,000 people served of all of the departments listed. So one of the things that higher tuition cost buys? Bigger campus police forces.
Now I will teach you how to make your own sortable, searchable web data tables!
As with our Absurdly Illustrated Guide To Creating Your First Dynamic, Data-Driven Timeline, today’s tutorial will use Tabletop.js. Tabletop.js allows us to use Google Spreadsheets as the data source for fast, flexible web and mobile apps without having to go through the extra work of setting up a relational database like MySQL. Even better, there are probably far more people on your team who feel confident about entering data into a Google Docs spreadsheet than going mano-a-mano with a database.
1. Download the tabletop-to-datatables code from Github:Tabletop To Datatables. Click on the ZIP file icon.
2. Unzip tabletop_to_datatables-master.zip. You will see files and folders inside the zip file that look like this:
3. Set up your data source.
First, log in to Google Docs and create a new spreadsheet.