Transcend® Translations has Legal Icons for download and use for all kinds of common legal issues. They are all black and white, with a variety of border/no-border options.
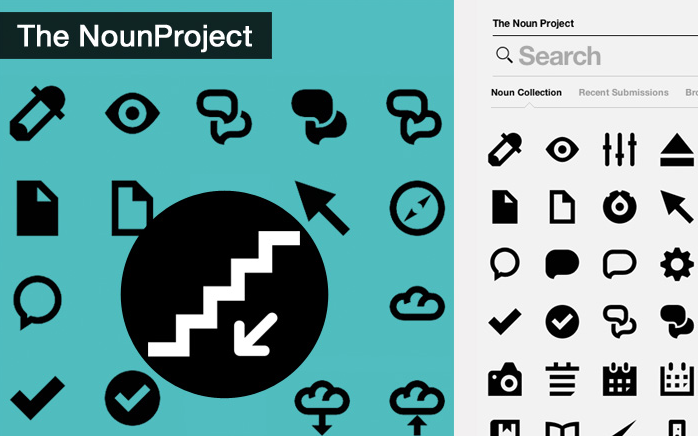
Legal Icon Set on the Noun Project
We have started building a collection of legal-themed icons on the Noun Project that you can download and use in your materials. If you have any requests for more, just write and let us know!
Get free-to-use Photographs on Unsplash

If you need to integrate photographs into your webpage, app, presentation or otherwise, you can find free-to-download-and-use images on Unsplash. You don’t need to sign up or give anything away, though they sometimes ask you to give feedback to thank the photographer. It’s a great, free resource for professional photos!
Make real-looking phone/computer photos with your screens
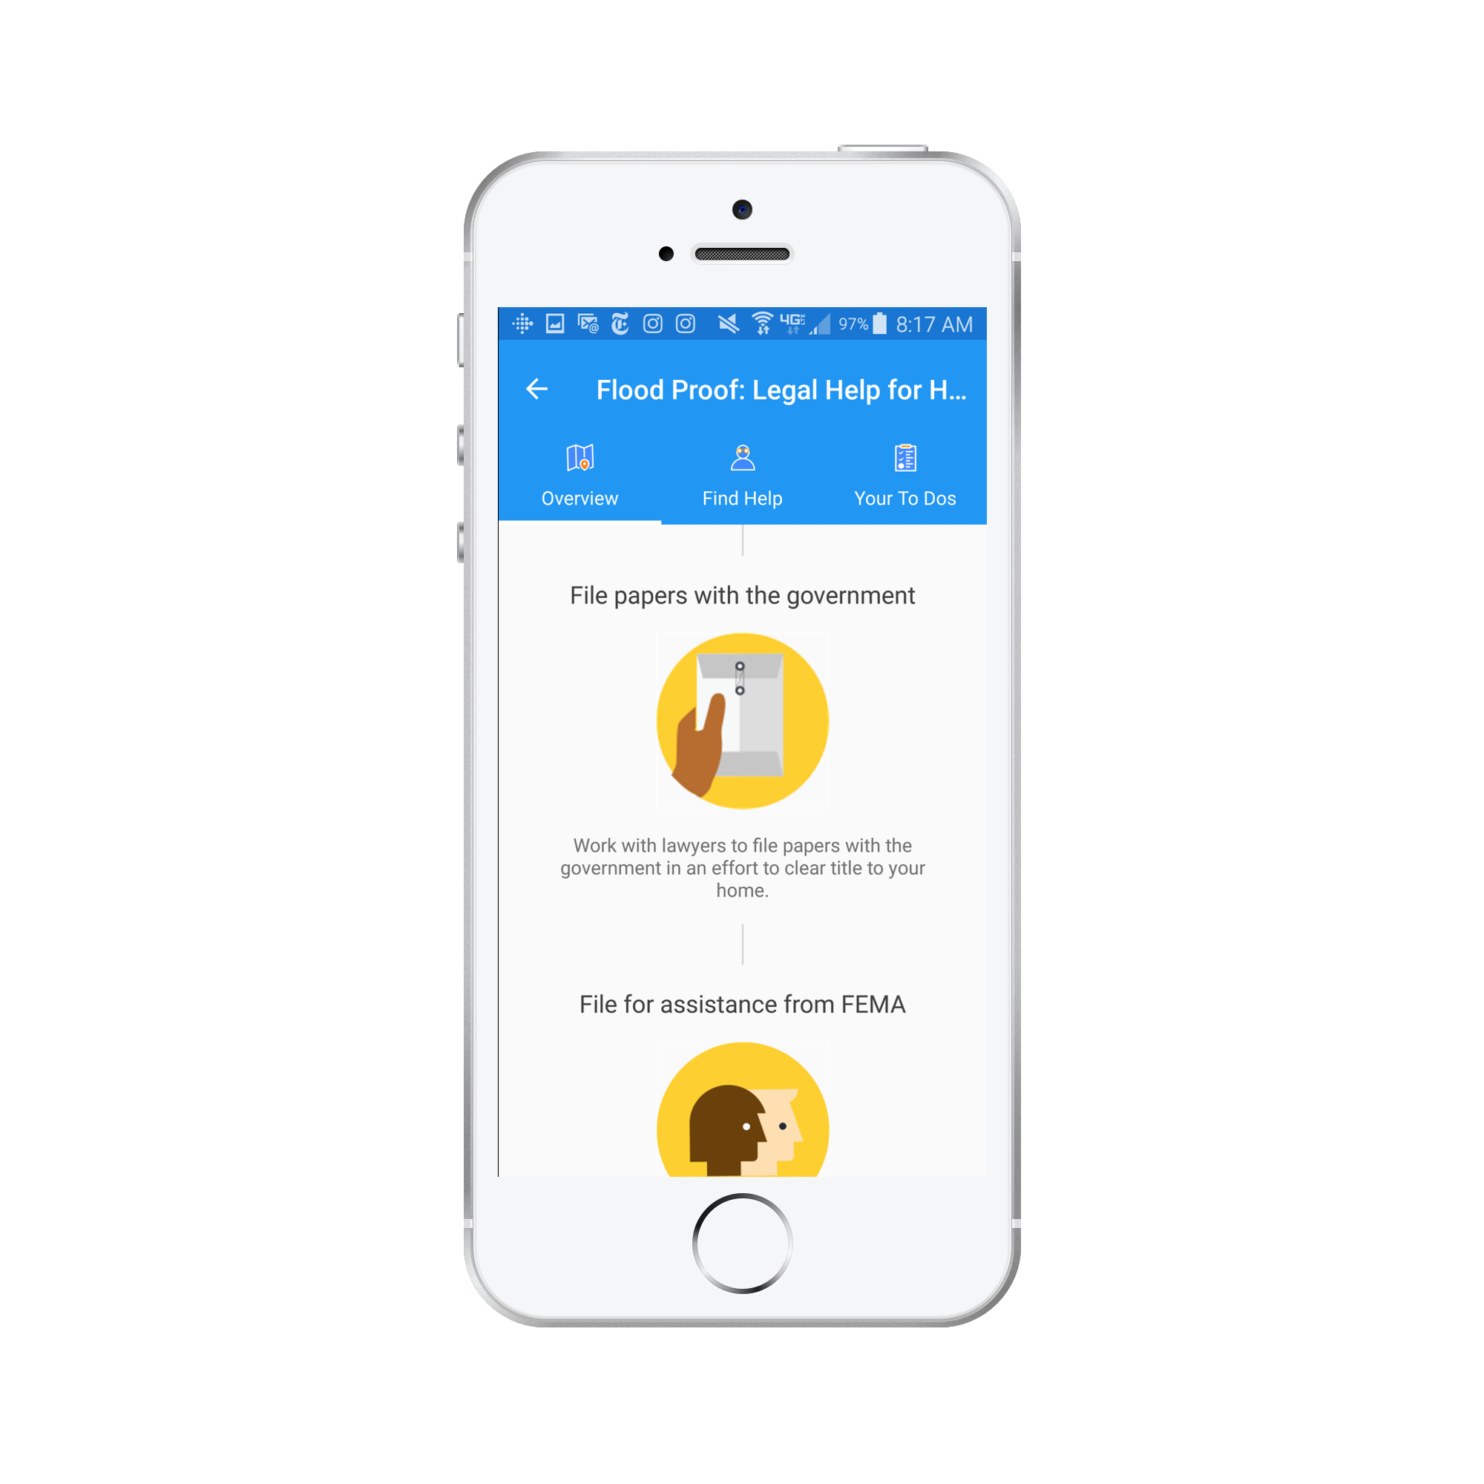
MockUPhone is a tool to make beautiful photos of your app screens look like they are on actual devices in use. It takes your digital design and makes it look real — a great envisioning and promotional tool. And it’s free (pay with your email address)
Map out customer journeys, with this template
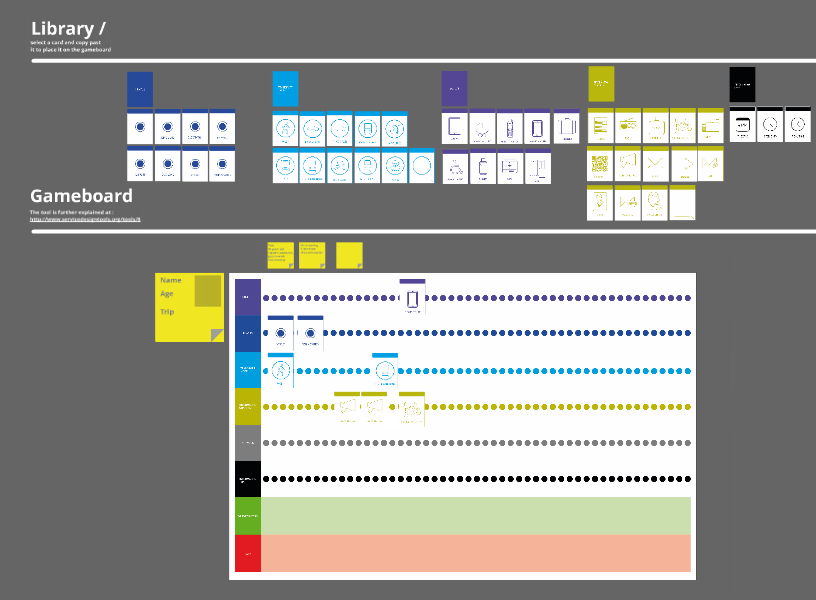
Christophe Talec has made a public and reusable template on Prezi, to map out customer journeys — a key step in any good service design work. See it here: customer journey mapping game (transport) by christophe Tallec on Prezi Use the canvas of Prezi to lay out steps along the pathways, and document how your user experiences the service you’re … Read More
Use Pexels for free stock photos

If you need photographs and other images for the new product or communication you’re creating, you can use Pexels. It is a repository of images you can use without payment, no problems.
Material icons from Google Design
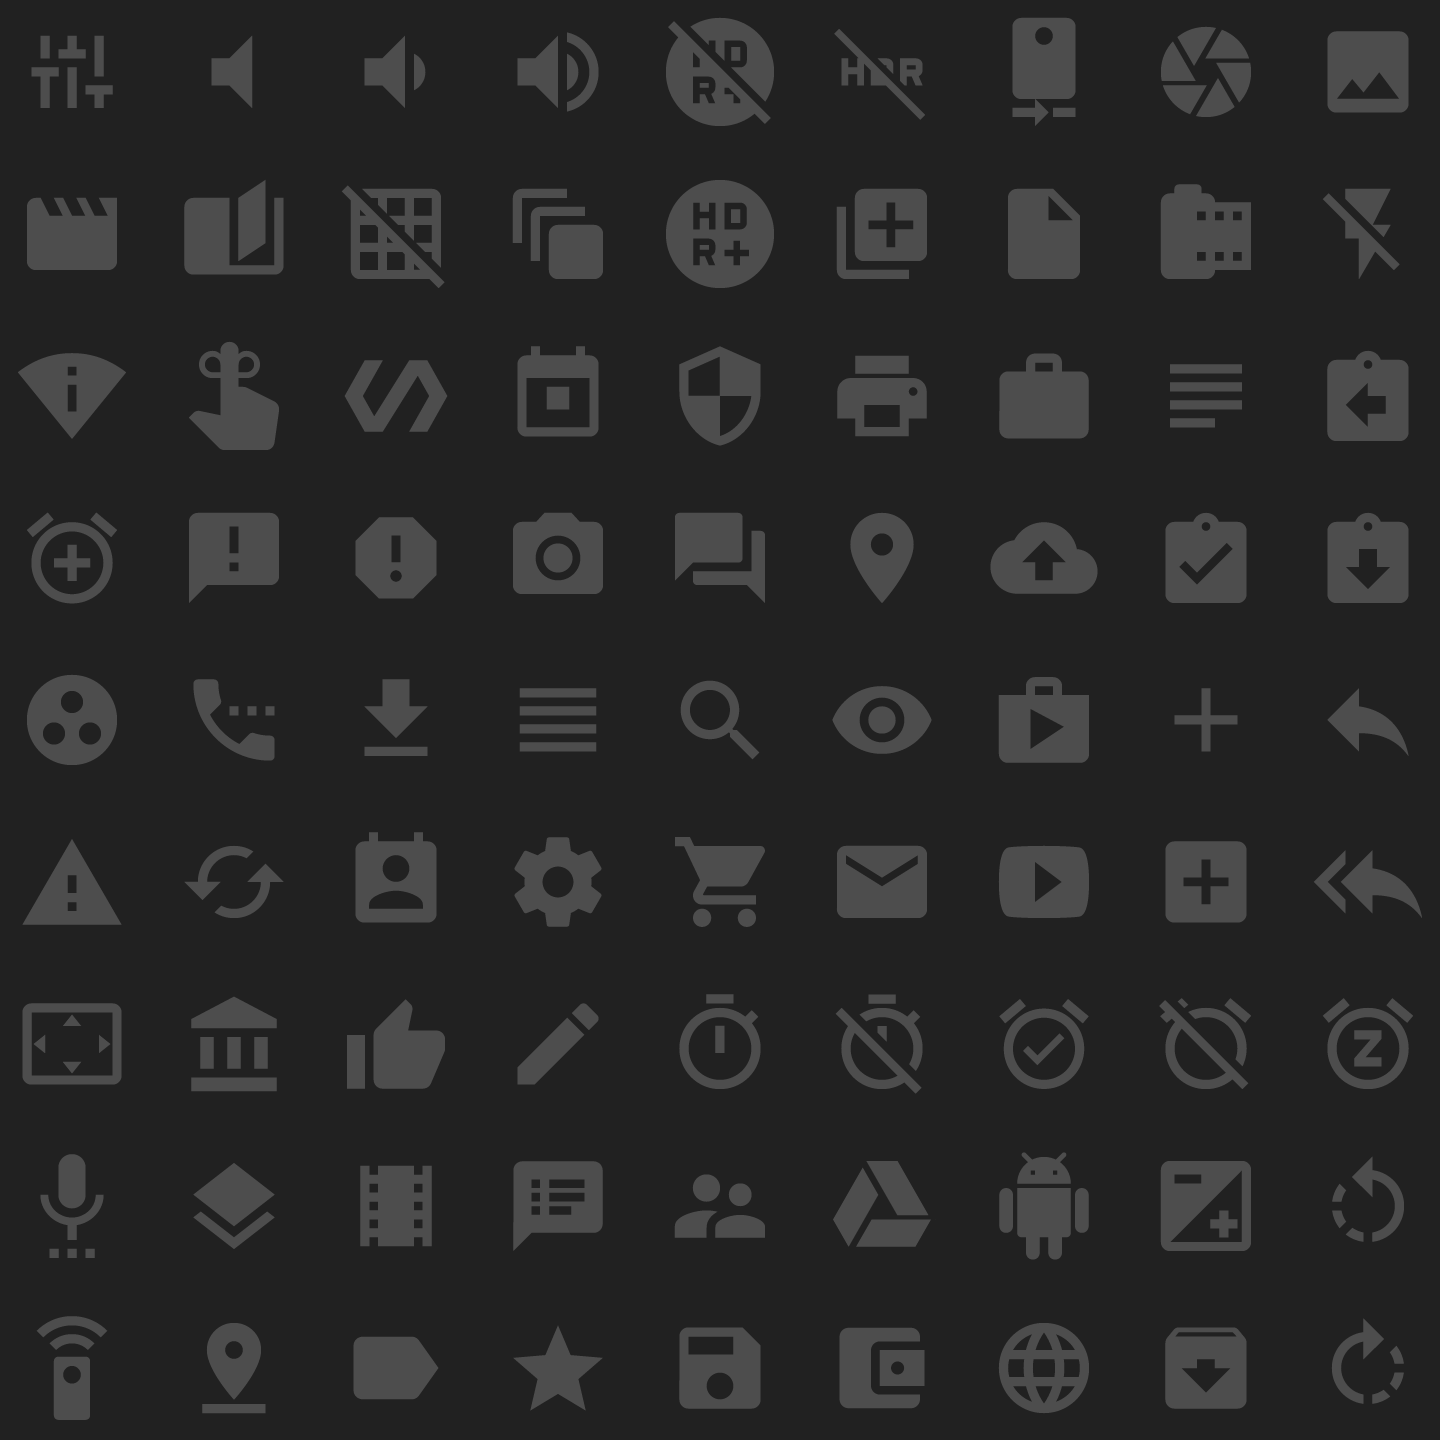
Material icons from Google Design are standardized icons free to use in your visual designs, and in your creation of web and mobile projects. They’re clean, sharp, and familiar to many. Use to make your designs better!
Visualise Data Options from Better Evaluation
The excellent site Better Evaluation has an enormous collection of data visualization tools & advice. It is a rich description of possible visual techniques to use to convey your data more effectively. Data visualisation is the process of representing data graphically in order to identify trends and patterns that would otherwise be unclear or difficult to discern. Data visualisation serves … Read More
Wordle: Create Beautiful Word Clouds
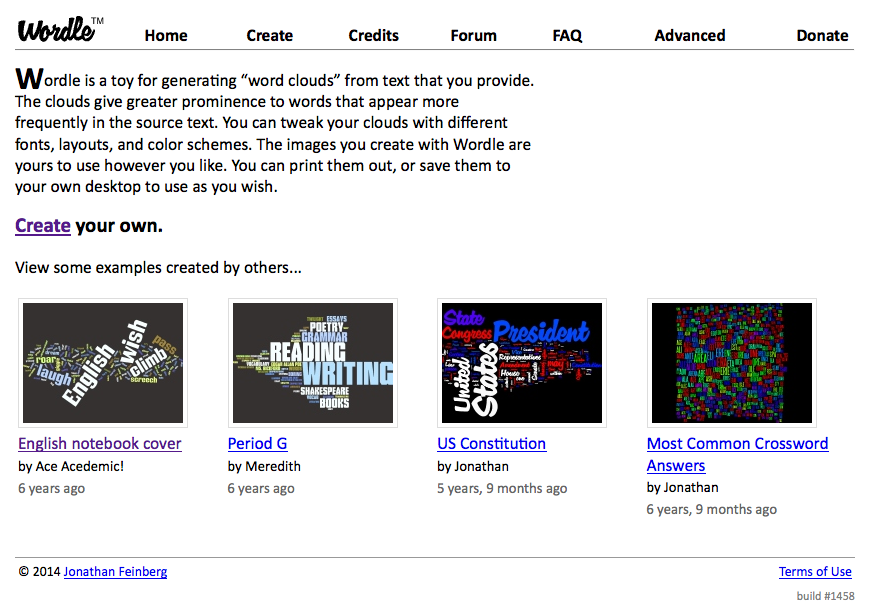
Wordle is a tool to make Beautiful Word Clouds. You can use it to analyze and understand large collections of text. Wordle is a toy for generating “word clouds” from text that you provide. The clouds give greater prominence to words that appear more frequently in the source text. You can tweak your clouds with different fonts, layouts, and color … Read More
Creating Animations and Transitions With D3

For the ambitious, this is a great intro to creating your own animations and transitions in d3.js. In interactive visualisation, there is the word reactive. Well, maybe not literally, but close enough. The fact is that reactivity, or the propension of a visualisation to respond to user actions, can really help engage the user in a visualisation, and help them … Read More
Making interactive visuals: Thinking in D3

Here is a presentation from Joe Golike, a data viz designer at Trulia, about how you can use the Javascript language/library D3 to make visualizations that are interactive, lively. It’s from SF a few years ago. And the slides for the presentation: Introduction to D3 from Visually
Using D3 to Make Data-Driven Visualizations
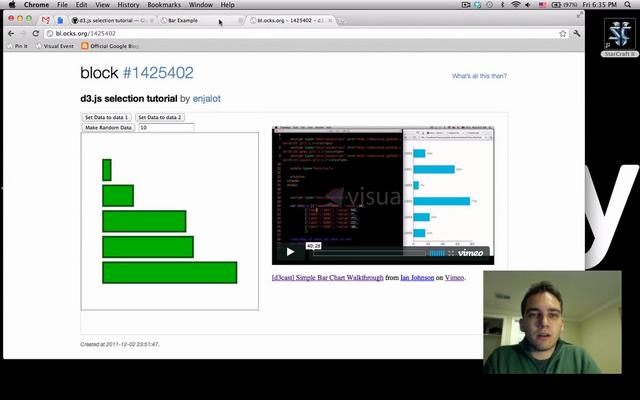
D3 is a new tool for designers and programmers working on creating interactive visualizations out of large data sets. We recently told you how to create choropleth maps in D3 with an easy, step-by-step tutorial. In this short video, we’ll go over the basics of using selections with d3.js to make data-driven visualizations. Source: Using Selections in D3 to Make … Read More
Fontello: icon fonts
Fontello – icon fonts generator is a tool to build custom fonts with icons — and also to borrow from other open icons to use in your own projects. What is Fontello Fontello is a tool to quickly pack vector images into webfonts. Consider it like Twitter Bootstrap, but for images. It builds everything necessary to include graphics into your … Read More
Creating Fillable PDF Forms With InDesign and Acrobat
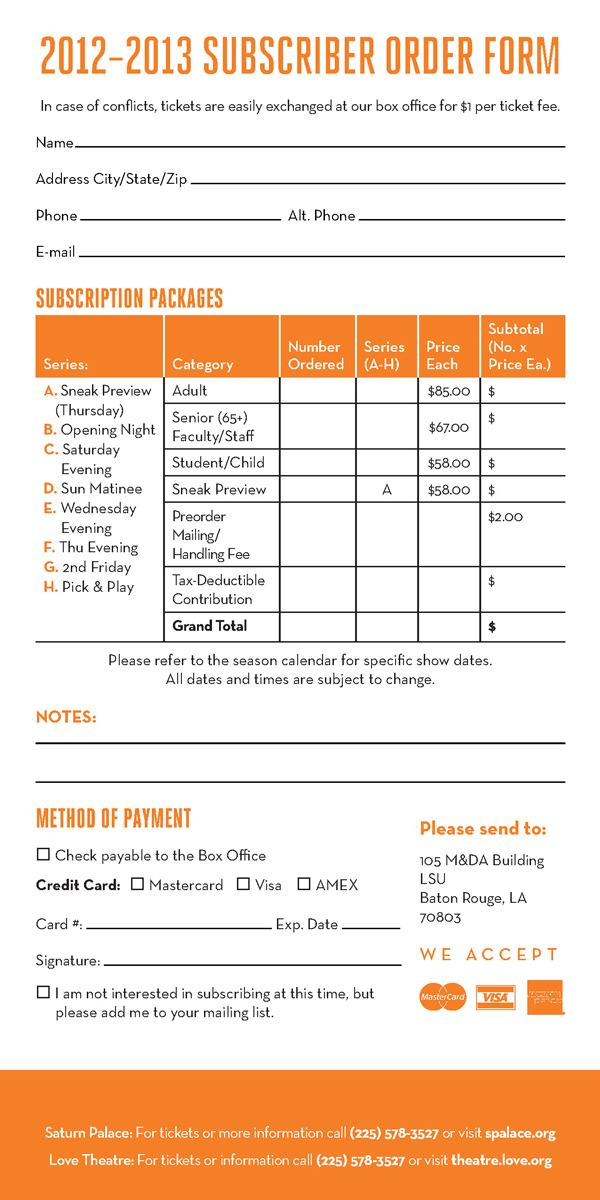
Do you want to create a form to distribute out to the public, that users can fill in (within constraints set by you)? Then it’s worth investing in some powerful software, beyond standard Microsoft Word & Adobe Acrobat Reader. Learning to use Adobe products like InDesign & Illustrator is useful to create PDFs that are more usable, interactive, and user-friendly. … Read More
How to create interactive PDF forms with Acrobat Pro
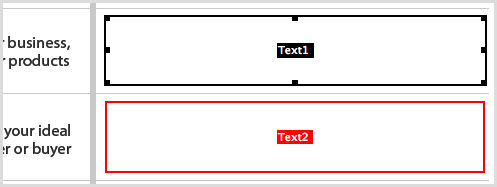
The Design Cubicle presents a tutorial on How to create interactive PDF forms using Adobe Acrobat Pro. It’s authored by Brian Hoff, see the full article at the link to read the entire tutorial. If you’re like me then you like everything from your website down to your legal contracts to look well designed and function to your client’s liking … Read More
Automate excel -> flowchart diagram with Visio

Here is a very instructional piece from Michael Angeles explaining how to use Excel databases & Visio diagramming software to transform a spreadsheet into a flowchart automatically. It requires some up-front planning & design, but it can be worth it if you make a lot of diagrams. Check out Automating Diagrams with Visio « Boxes and Arrows for the full … Read More
Design pattern libraries for desktop & mobile software
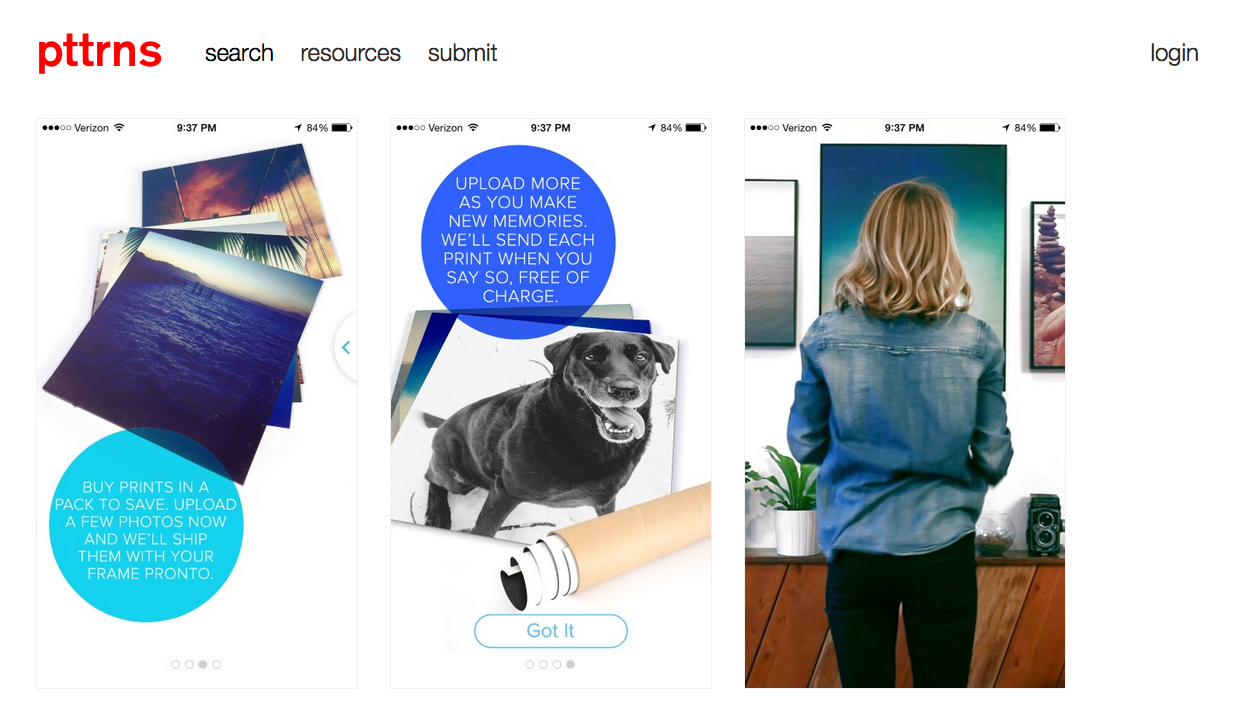
One of the best ways to quickly develop your vision of a new software product (or overhaul of an existing one) is to visit Design Pattern Libraries, that can show you how other talented designers have laid out interfaces for certain functions. I’ve gathered together links to useful design pattern libraries for both desktop & mobile software interfaces. You can … Read More
infogr.am: create Infographics & Charts
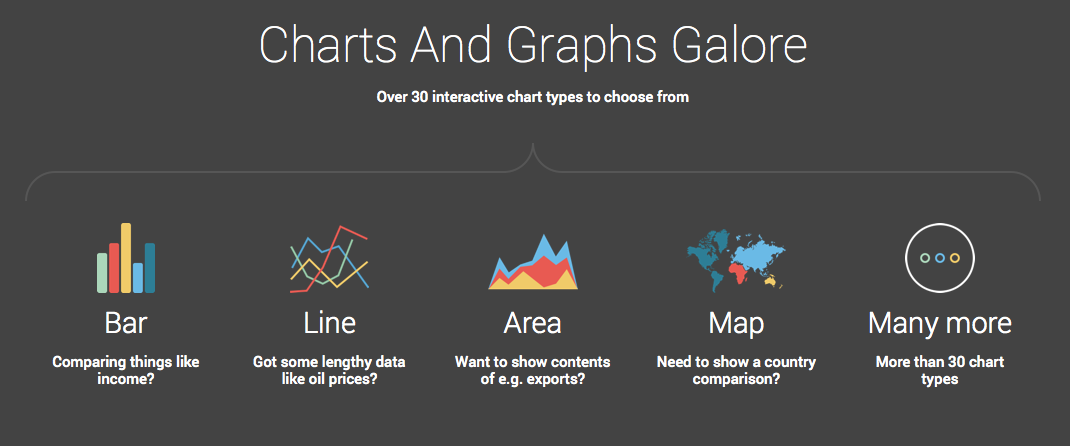
Infogr.am is a browser-based tool to visualize your data. It has a range of free infographics and charts to plug your data into, and then customize the look of. Or if you are a paying customer, you have a lot more options. Infogr.am is an easy app for creating infographics on the web. You can build real-time, interactive, beautiful, shareable, … Read More
easel.ly : create visuals
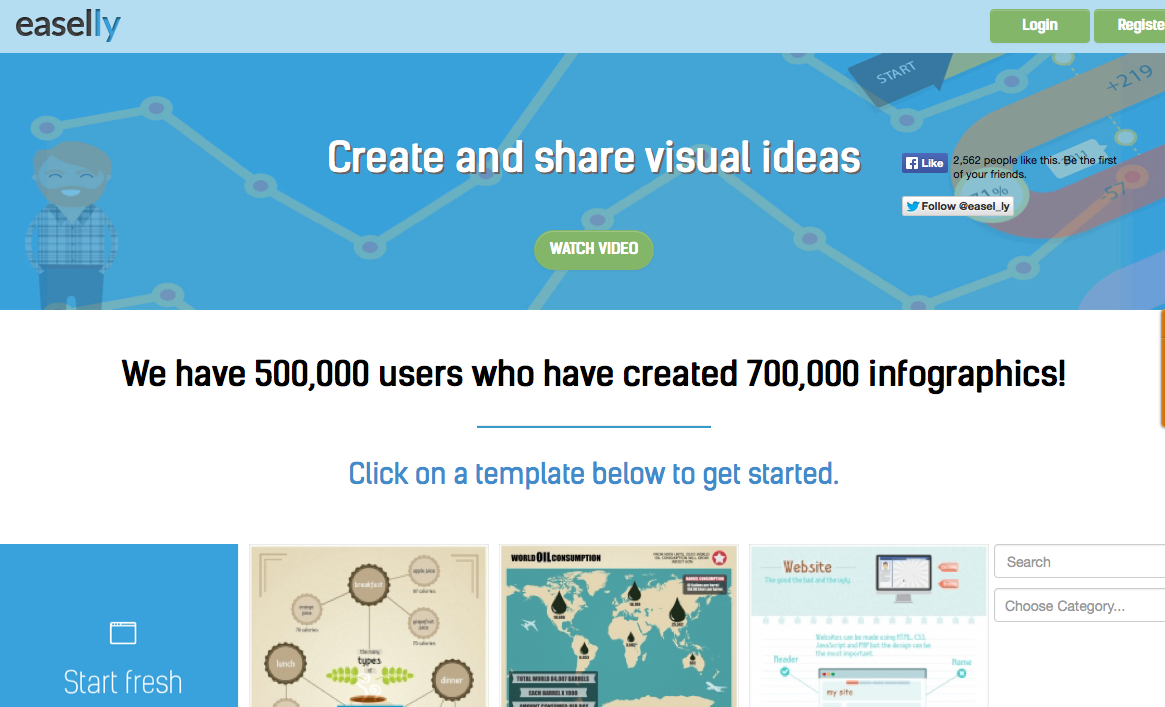
Easel.ly is an online tool to let you build infographics and charts with easy template layouts & stencils. Easel.ly is a website that features thousands of free infographic templates and design objects which users can customize to create and share their visual ideas online. Using the site is as easy as dragging and dropping design elements, and users can either … Read More
Canva – easily create graphic designs in your browser
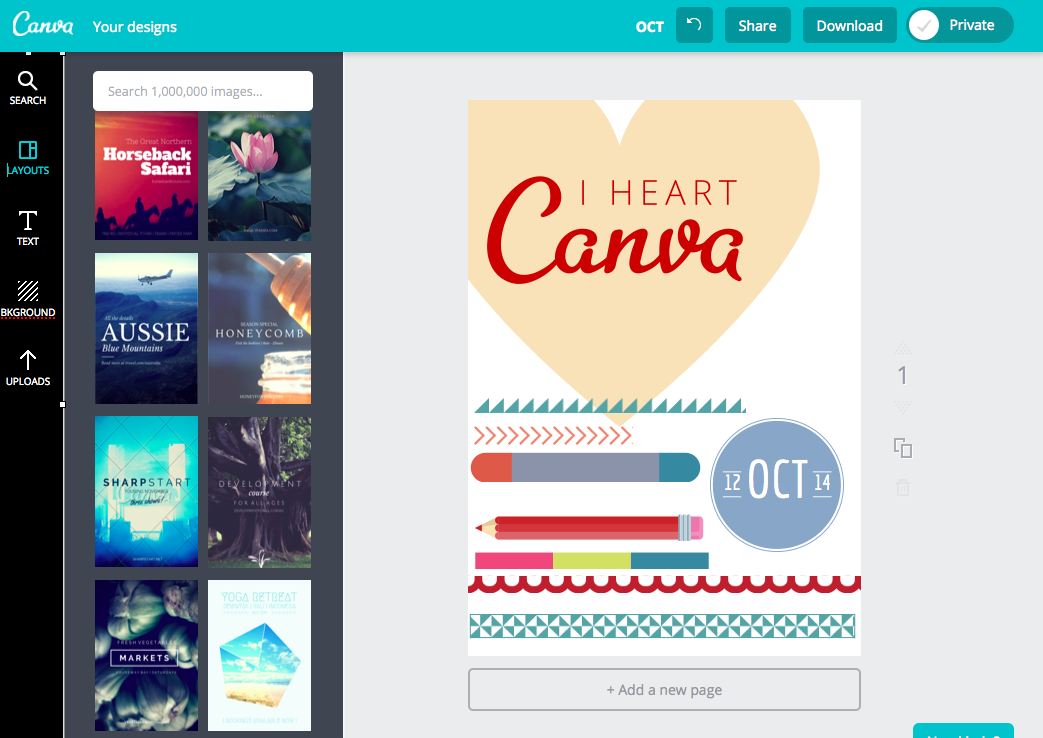
Canva is an amazing browser-based tool to very easily mix your own gorgeous graphic design image. It provides you with well-designed layout templates, text, stencils, vectors, and free images for you to then feed into your own composition. It is very intuitive to use as an authoring tool. It gives you lots of choices, but supplies you with enough guidance … Read More
Color-Hex page for web colors & palettes
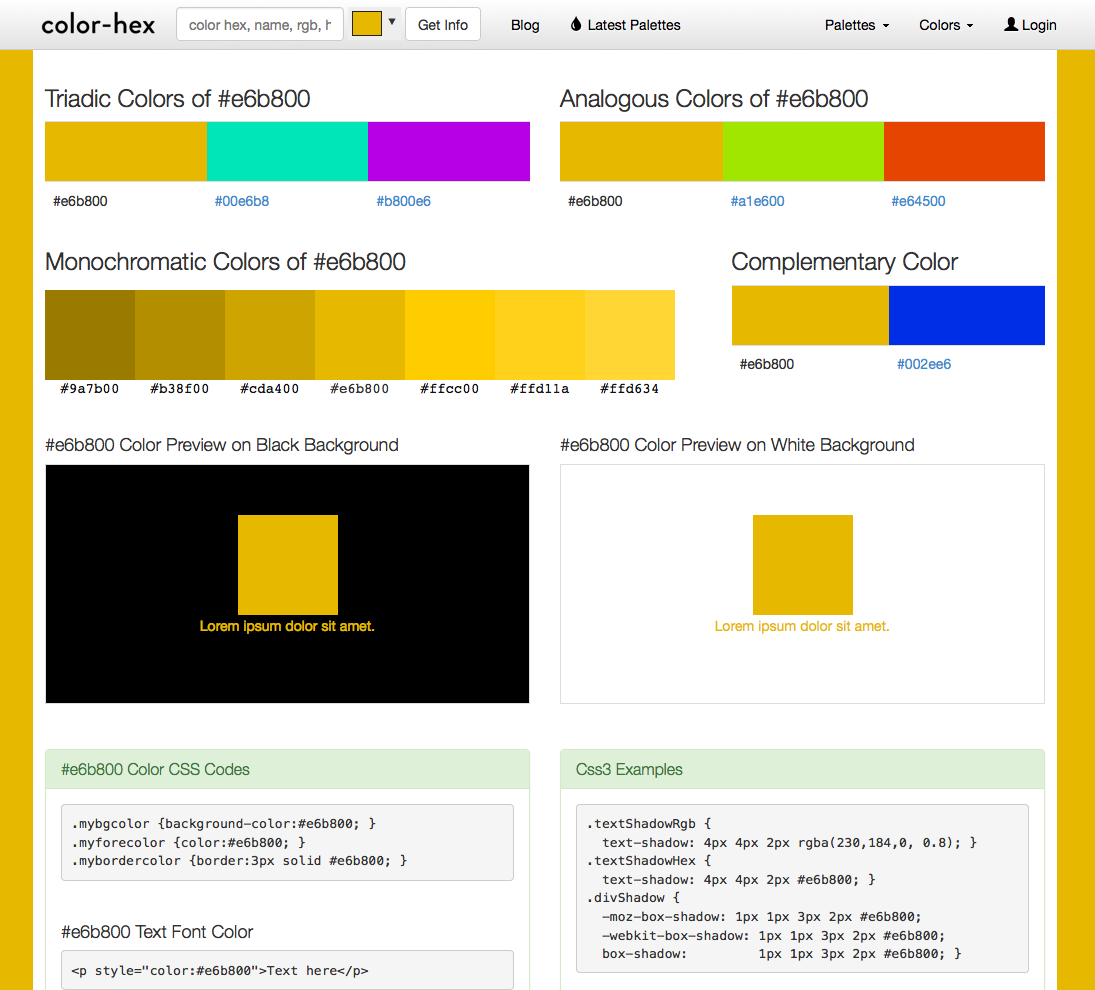
Color Hex is a particularly rich site for finding good colors & palettes. It has all the information you need to deploy colors online, as well as to find good mixtures to use.
Draw | LibreOffice
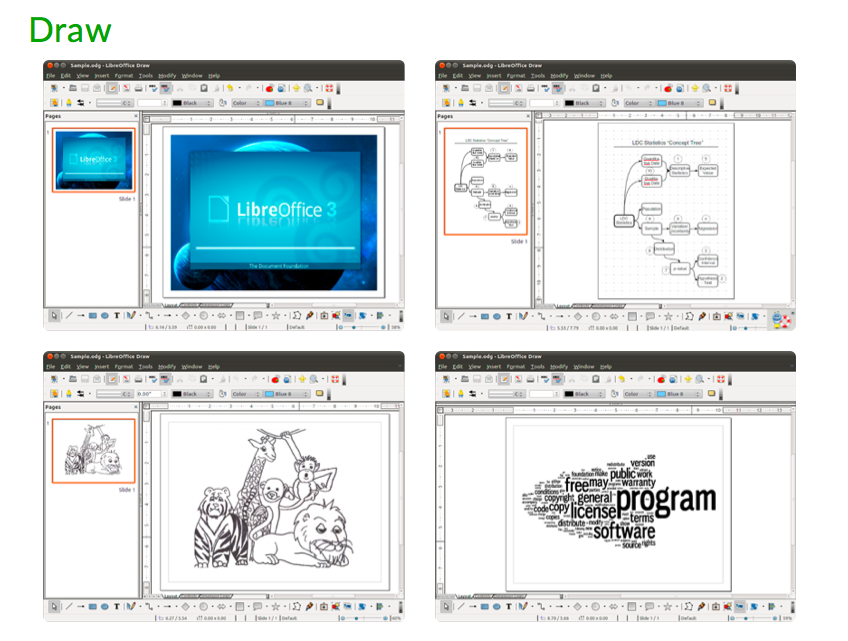
via Draw | LibreOffice – Free Office Suite – Fun Project – Fantastic People. LibreOffice is a free, opensource set of desktop software. It offers several visual design functions. Draw lets you produce anything from a quick sketch to a complex plan, and gives you the means to communicate with graphics and diagrams. With a maximum page size of 300cm … Read More
XMind: software for diagramming and mapping
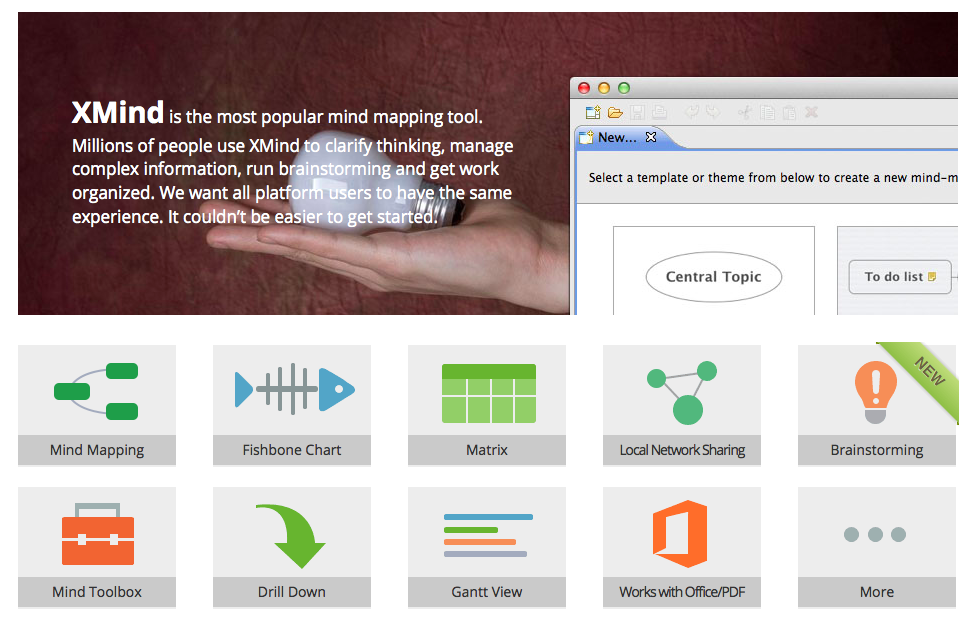
I love XMind: Mind Map Software and use it to create diagrams and flowcharts. XMind is the most popular mind mapping tool. Millions of people use XMind to clarify thinking, manage complex information, run brainstorming and get work organized. We want all platform users to have the same experience. It couldn’t be easier to get started.
Dia draws structured diagrams
Dia software is a free Windows, Mac OS X and Linux version of the popular open source program. It lets you create flowcharts and diagrams. It also has a library of free shapes to use. You can use these to customize your diagrams.
Amazon Storyteller for creating visual stories

Amazon Storyteller is a great resource for anyone who wants to quickly create a graphic narrative. Though Amazon has released this story-visualizer as tool for movie-makers, it is also useful for anyone who wants to tell a visual story. This could be the lawyer who wants to author a graphic version of a legal process. Or it could be a … Read More
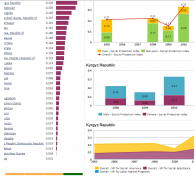
Datawrapper for making charts, graphs and maps
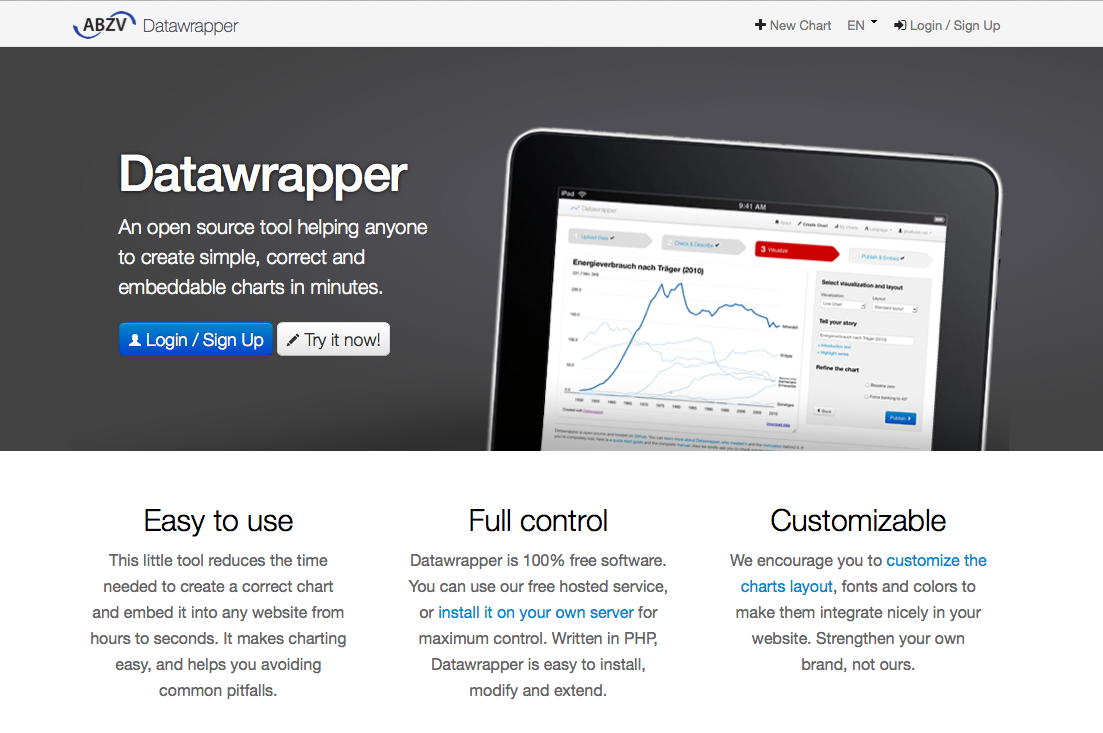
Datawrapper is an open source project started out of a German training institution for newspaper journalists. It is a free software service that lets you easily create correct charts that you can embed online. Here is their quick start guide: If you just want to give Datawrapper a try, here is a brief run-through. Principle: First the data, than the … Read More
Make Infographics with Piktochart

Piktochart is an online, paid tool to create your own infographics easily, by plugging in your data into their templates. You can also create reports, banners, and presentations with their tool. Here is their basic tutorial overview of how to make an infographic with their tools: With Piktochart’s tools and features, you’ll be an infographic making genius in no time. … Read More
A Beginner’s Guide to Making Infographics
Here’s an excellent article from Rachel Banning-Lover on The Guardian, intended particularly for NGOs and relief workers, via the Global Development Professionals Network | Guardian Professional. How to make infographics: a beginner’s guide to data visualisation An interactive map of attacks on health care in Syria – the blue spots show attacks by government forces. Photograph: Physicians for Human … Read More
Creating Static and Interactive Infographics with Illustrator and Muse
An article from Jim Babbage on Adobe’s Blog, via Creating Static and Interactive Infographics with Illustrator and Muse. Creating Static and Interactive Infographics with Illustrator and Muse This week, the team I work on at Adobe was given a special task; to create new education-based assets to use in demonstrations, tutorials and to share with educators and other education colleagues. … Read More
The Pencil Project: Open-source diagramming & wireframing
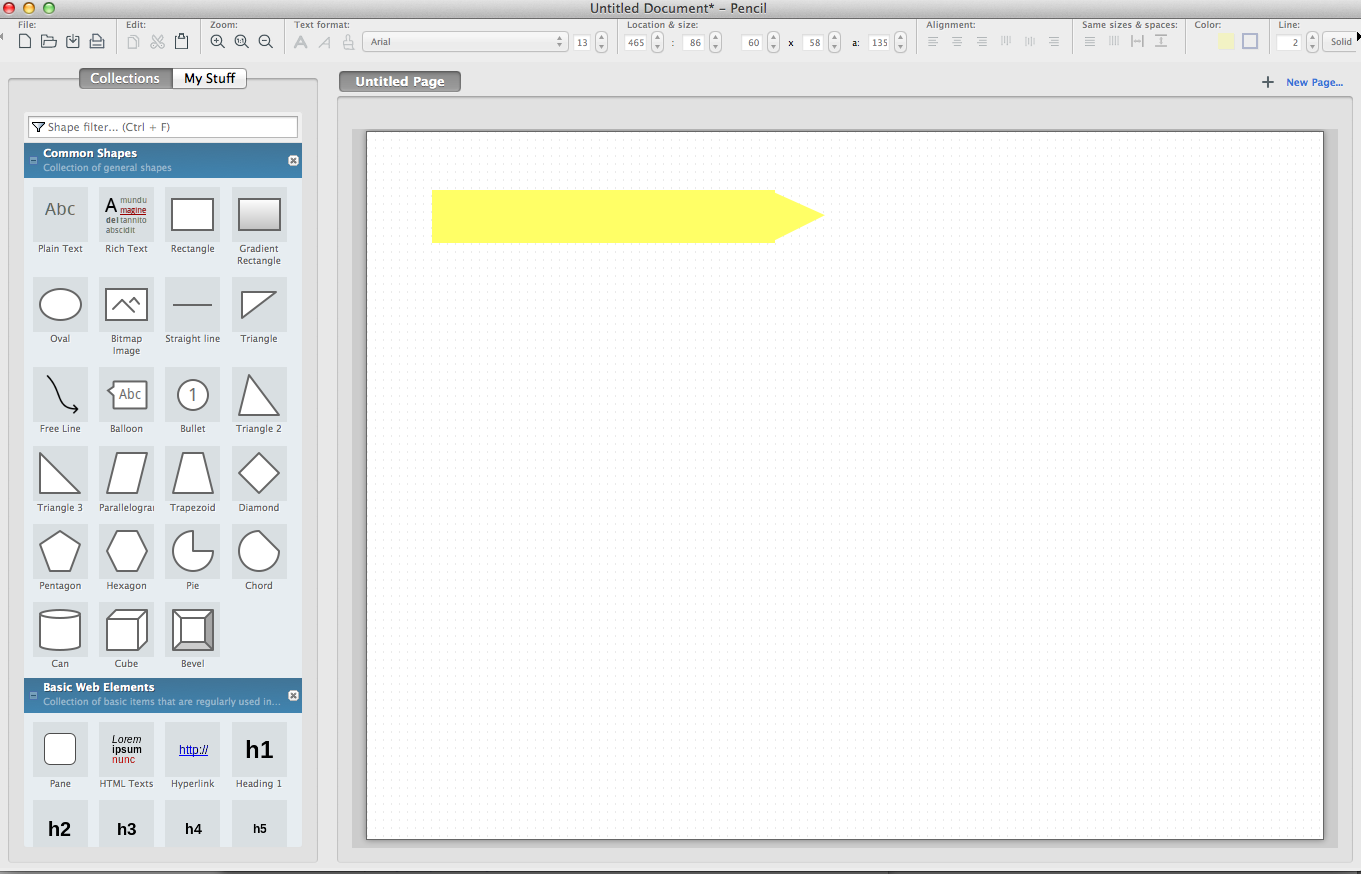
The Pencil Project is an open-source software for all operating systems, that lets you quickly create mockups, prototypes, flowcharts, and diagrams. It is absolutely free & very easy to use. You can download additional free stencil packs from here.
Gliffy: online tool to create diagrams & wireframes
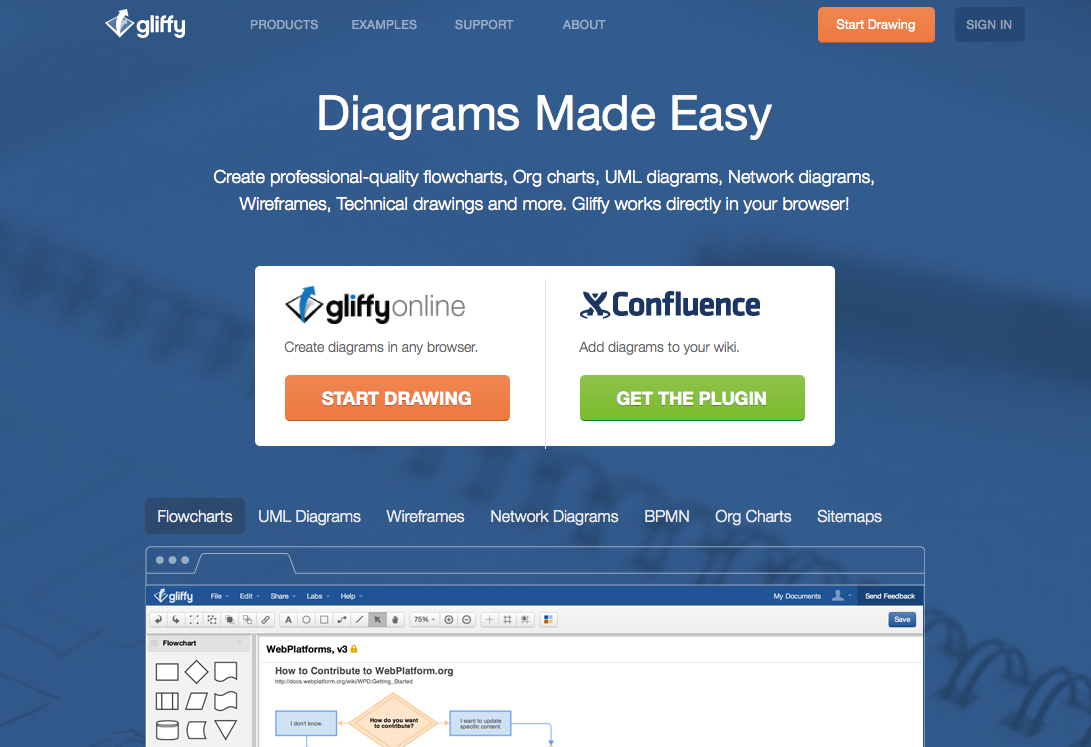
Gliffy is a brows-er based piece of software that lets you create diagrams, organization charts, wireframes, and technical drawings.
Draw.io to make visuals
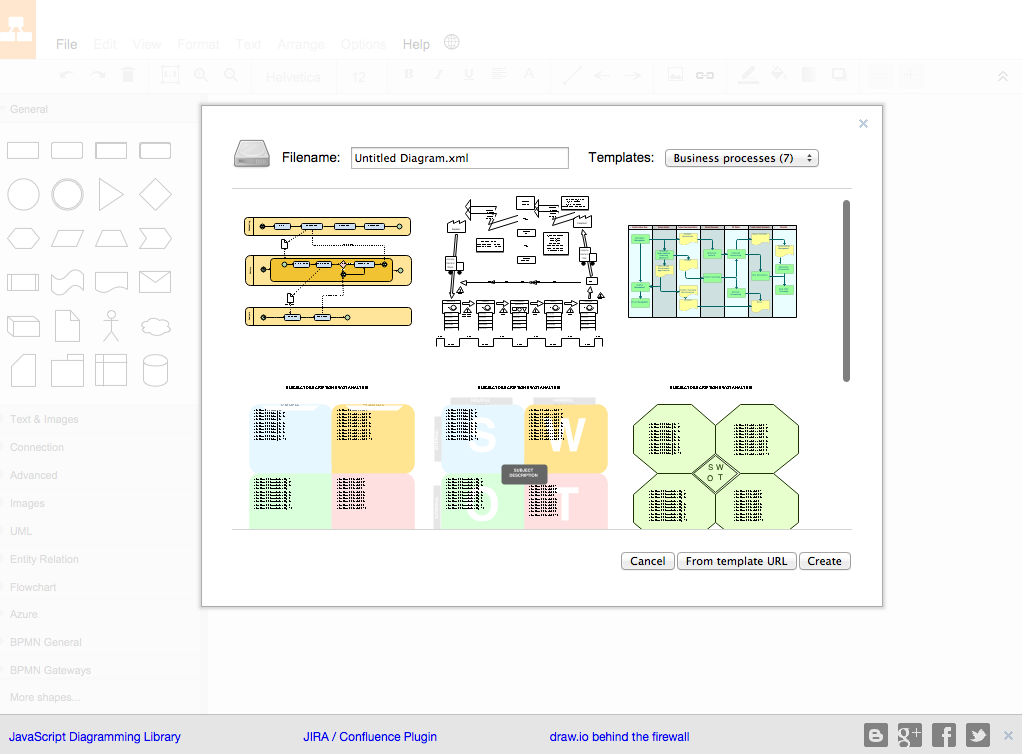
Draw.io is a free online service to create diagrams, tables, maps, and other process visuals. You create it in your browser using their templates & image library, and then can export it to your own storage. They offer a rich set of templates for your diagrams, which you can then deploy & rearrange to better fit the end product you … Read More
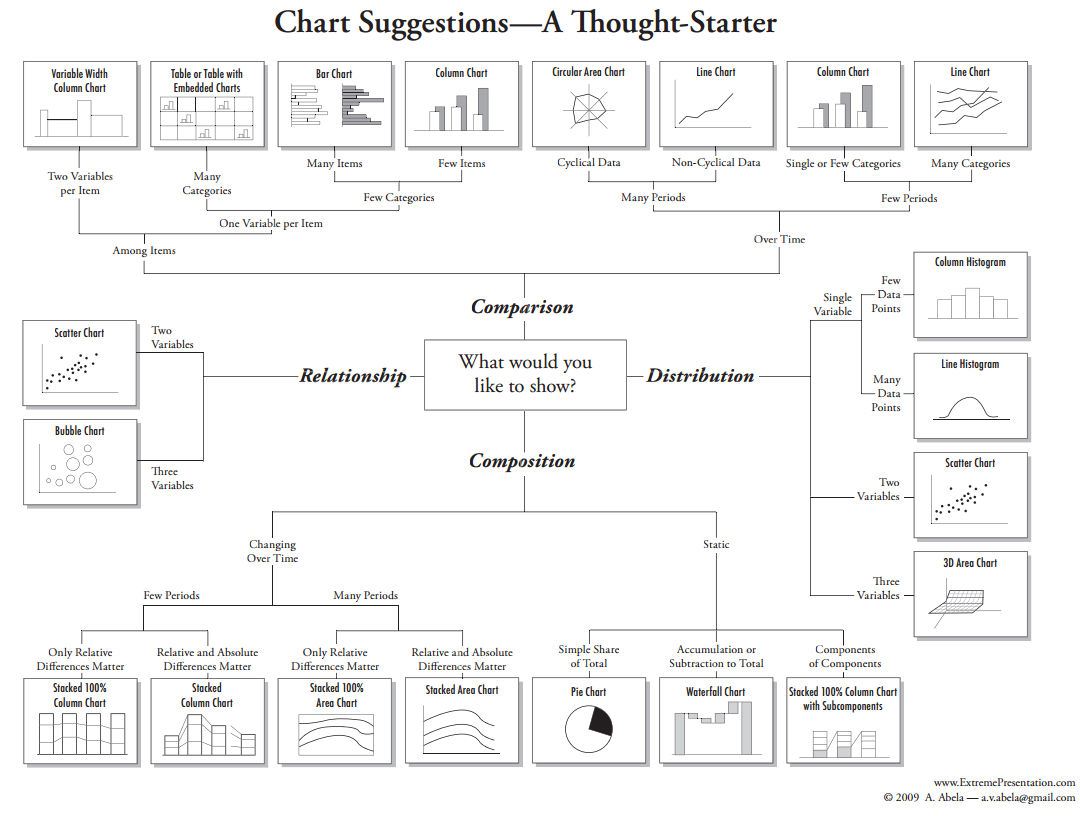
A Periodic Table of Visualization Methods
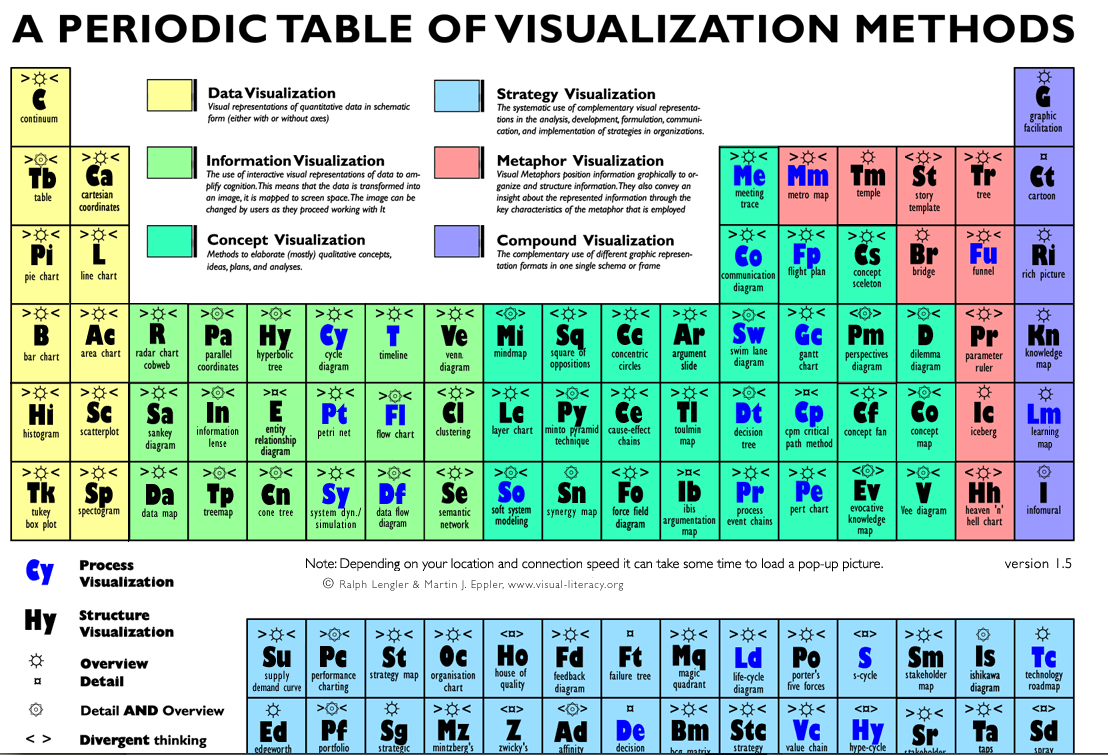
A Periodic Table of Visualization Methods. from Ralph Lengler & Martin J. Eppler at www.visual-literacy.org This interactive table presents a systematic overview of tools to use when trying to visualize different things — and hover over any of the types, and see an example of exactly that pop-up. So cool & useful!
Visualization for Lawyers
Welcome! This Visualization for Lawyers page will be a running resource for lawyers, law students, paralegals, and other people coming from the legal profession who want to learn how to visualize their content in more effective ways. First is a Typology: a guide to what tools you use for a specific type of communication you want to achieve. Second are Resources: … Read More
Make Infographics in PowerPoint
5 Infographics to Teach You How to Easily Create Infographics in PowerPoint [+ TEMPLATES].
Create beautiful Venn Diagrams
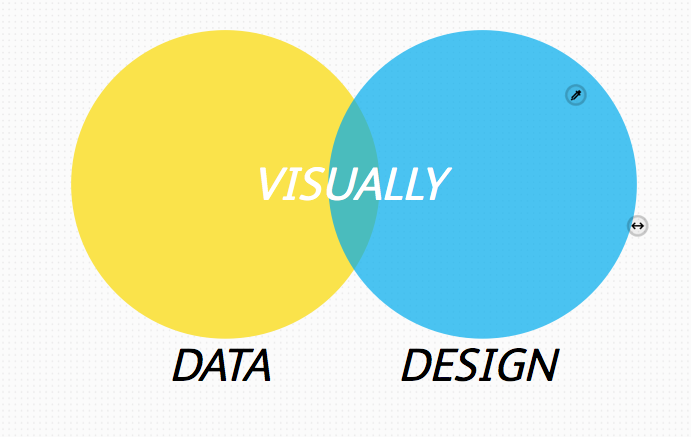
Visual.ly has a very easy tool for you to create venn diagrams, compose them beautifully, and download them. It’s a quick simple app to use to make a very clean visual.
Make Interactive Visuals with D3
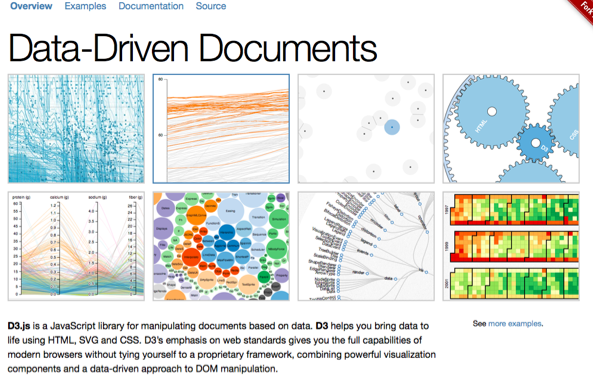
D3 is a way to make interactive visualizations from datasets, that you can display online, embedded in HTML. Make complex data usable, visible, and powerful! How to use D3 in your project? I you know how to use JavaScript, you’re off to a great start. For people who want to look through a bunch of tutorials and exercises, check out … Read More
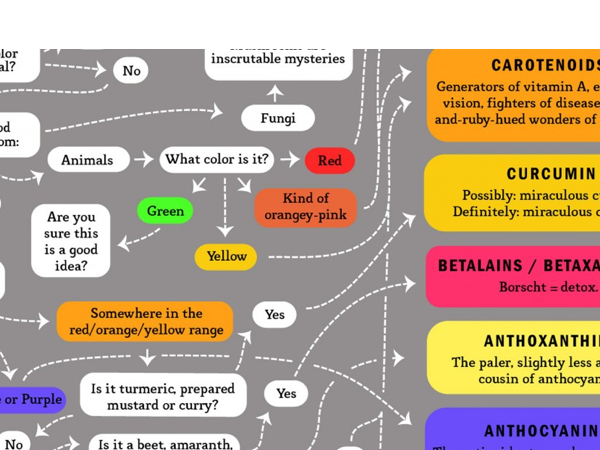
Visualizing Information: Good Diagram examples
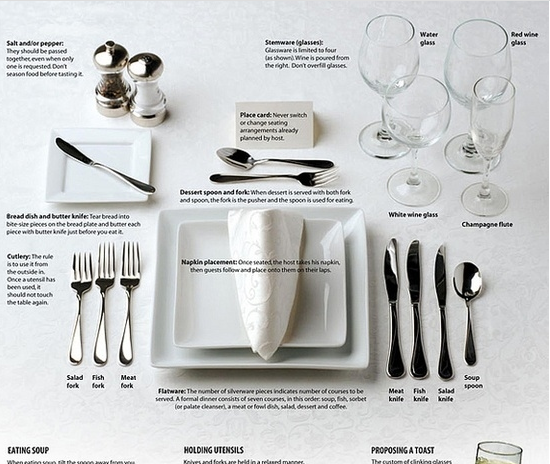
Collected from: 21 very important diagrams that you must save on your computer | naijaPOSE.
Make an Interactive Flowchart in Excel
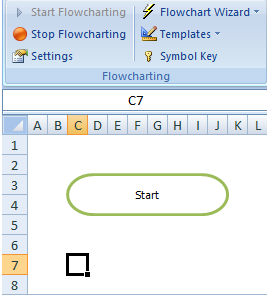
Here is an Interactive Flowcharting Tutorial – FlowBreeze Help. This tutorial will take you through the steps to create a flowchart using the interactive flowcharting mode of FlowBreeze. Because FlowBreeze is an Excel add-in, it will load with Excel but the interactive text-to-flowchart generation remains idle until you start a flowcharting session. It will operate on only one worksheet at … Read More
Make Interactive Visualizations: Graphviz
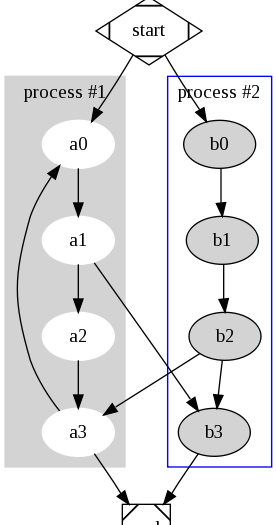
Graphviz | Graphviz – Graph Visualization Software. Graphviz is open source graph visualization software. Graph visualization is a way of representing structural information as diagrams of abstract graphs and networks. It has important applications in networking, bioinformatics, software engineering, database and web design, machine learning, and in visual interfaces for other technical domains. The Graphviz layout programs take descriptions of … Read More
Learn to make Icons

Here is a five-part free tutorial from Skillshare, taught by the Noun Project, on how to create beautiful & crisp icons for your designs. Especially since there is a lack of legal icons, this is a great way to learn how to go from sketches to usable & sharp visuals. This class is perfect for anyone wanting to learn more … Read More
Free icons, vectors, and pictograms
This website is full of examples of great free icons, symbols, vectors, and pictograms to use in your designs: Awward’s collection of Vector icons and Icon Webfonts for Interfaces and Responsive web design. Browse through and download these great resources for making your designs and documents look sharper, professional, and creative.
Vector line icons

This is a free set of beautiful, sharp icons to use in your designs from the Linecons Free – Vector Icons Pack by Designmodo. You can download this pack and you will have each of these icons in all the formats you might need to use in your designs — PNG, photoshop, illustrator, pdf, and webfont. Icons are usable to … Read More
visualizing.org: Data Visualization community
Visualizing.org is a site that collects together a community of people who are visualizing complex issues through data & design. It includes some political, governmental, and legal issues. It is rich with examples of good visualizations — maps, diagrams, tables, infographics, and more. It also has challenges & support for those who want to sharpen their visual skills.