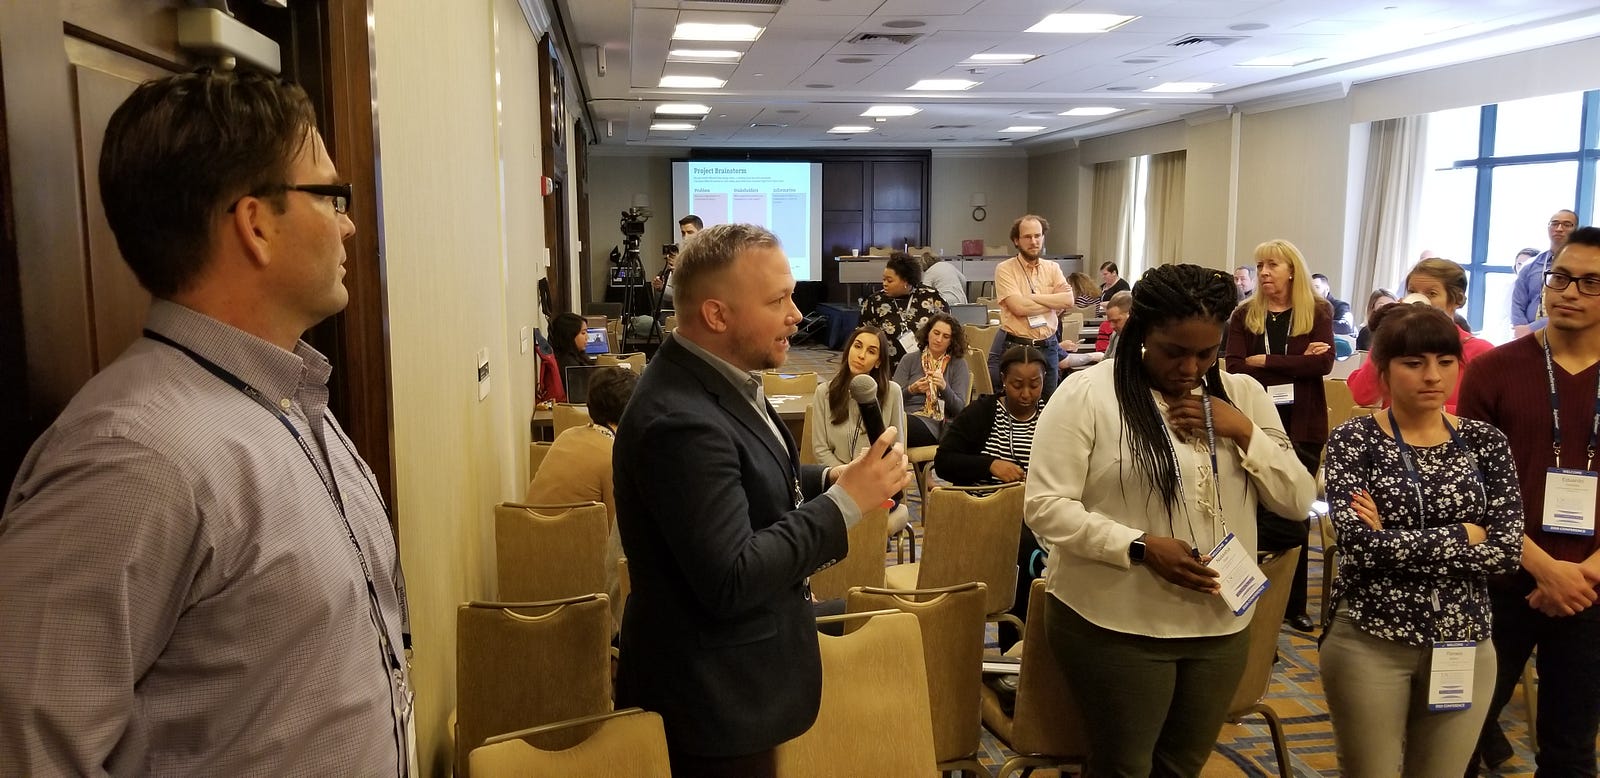
Along with Carlos Manjarrez from Legal Services Corporation, I ran a short Data Camp for legal aid leaders earlier this month, at the LSC ITCon in New Orleans. This was a test run for a possible longer Data/Design camp that we could run in the future. The big goals:
- Increased Data Literacy Educate more legal experts in the basics of data work, to improve their literacy and comfort with it, so that there is more willingness of more diverse leaders to join in data conversations.
- Spot Data-Project Potential. Help them reflect on what data sources they already have easy access to — and to help them focus in on what problems they have (day-to-day or larger policy/system-level) where data could be of use to them. This can speed up the development of more ambitious and interconnected legal tech efforts, or evidence-based policymaking.
- Build a Coherent Ecosystem. If we can do data projects alongside each other, with shared datasets, project plans, and problem-solving, then we can amplify individual groups’ limited resources and staff-time. Ideally, we in the legal aid community can be thoughtful and resourceful as we enter into new data-driven initiatives. Also, if we are coherent, then we can hopefully better connect with other civic tech communities, working on linked problem areas around health, social services, smart cities, philanthropy, and non-profits.
Our 2 hour Data Camp was a prototype of a much-longer possible day-long or several-day camp. We were inspired by the School of Data model, that educates journalists and non-profits in the essentials of data work.
What Happened
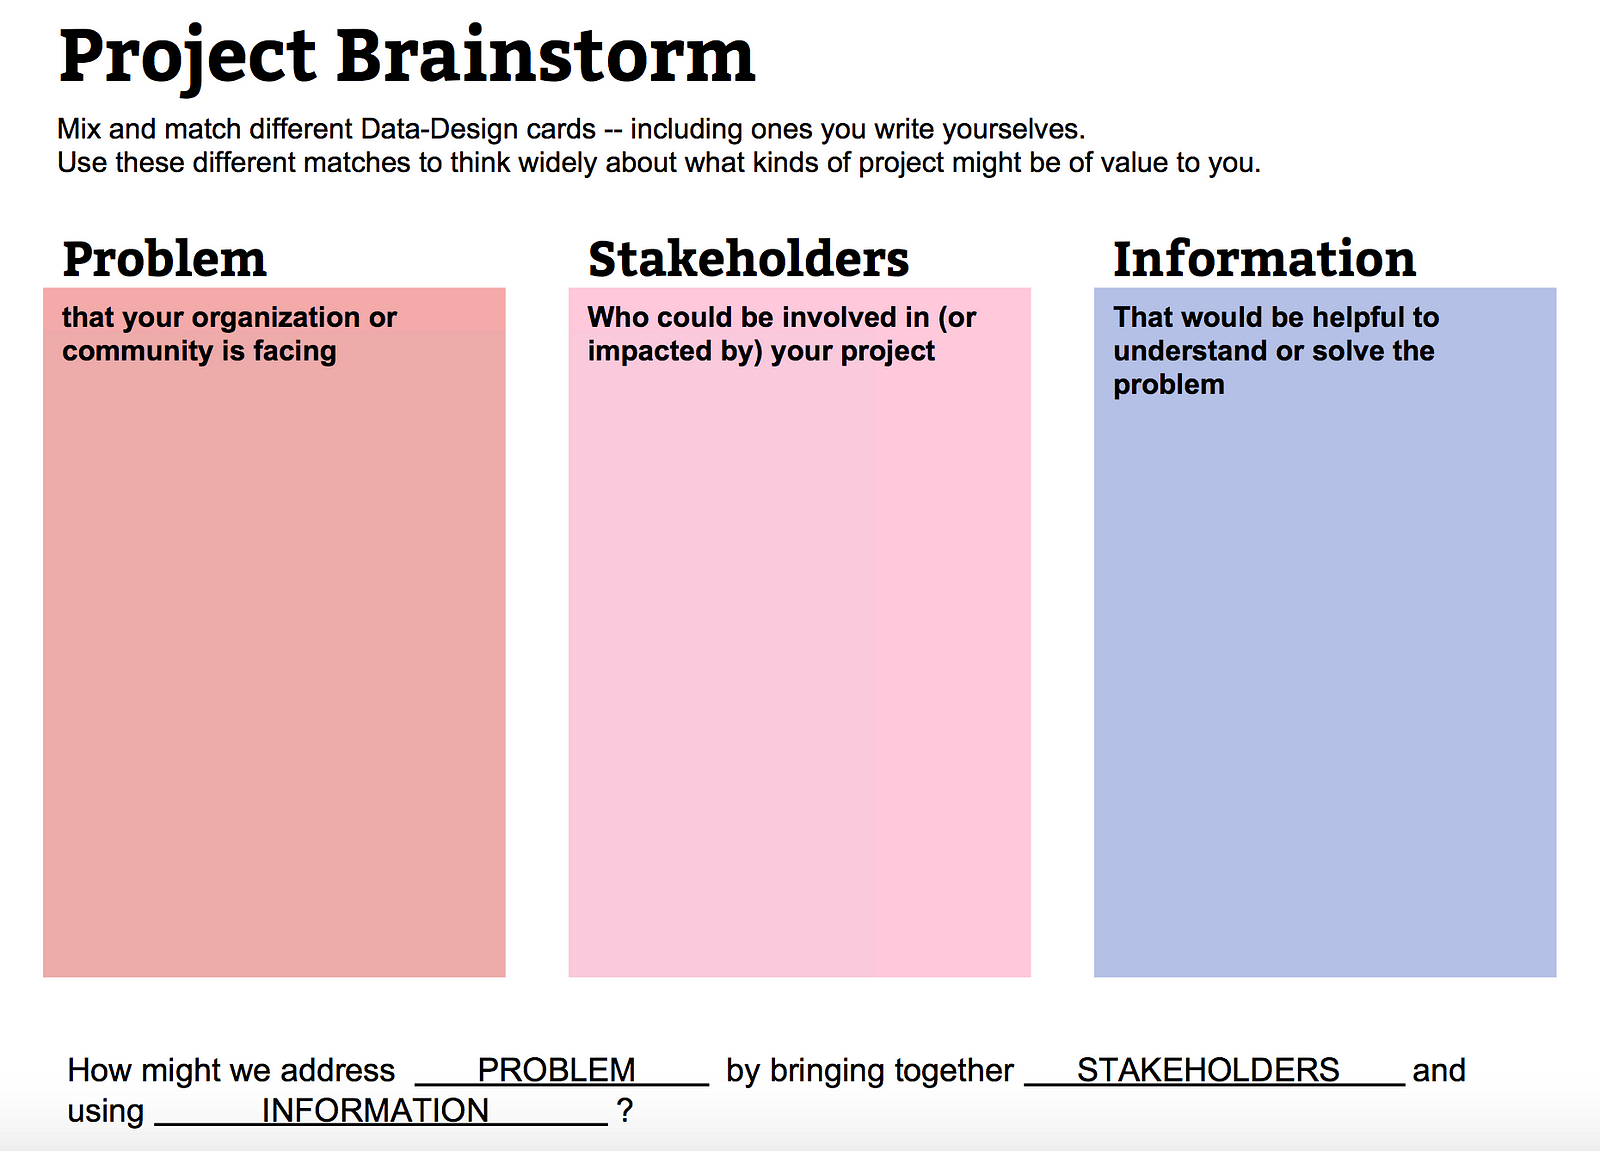
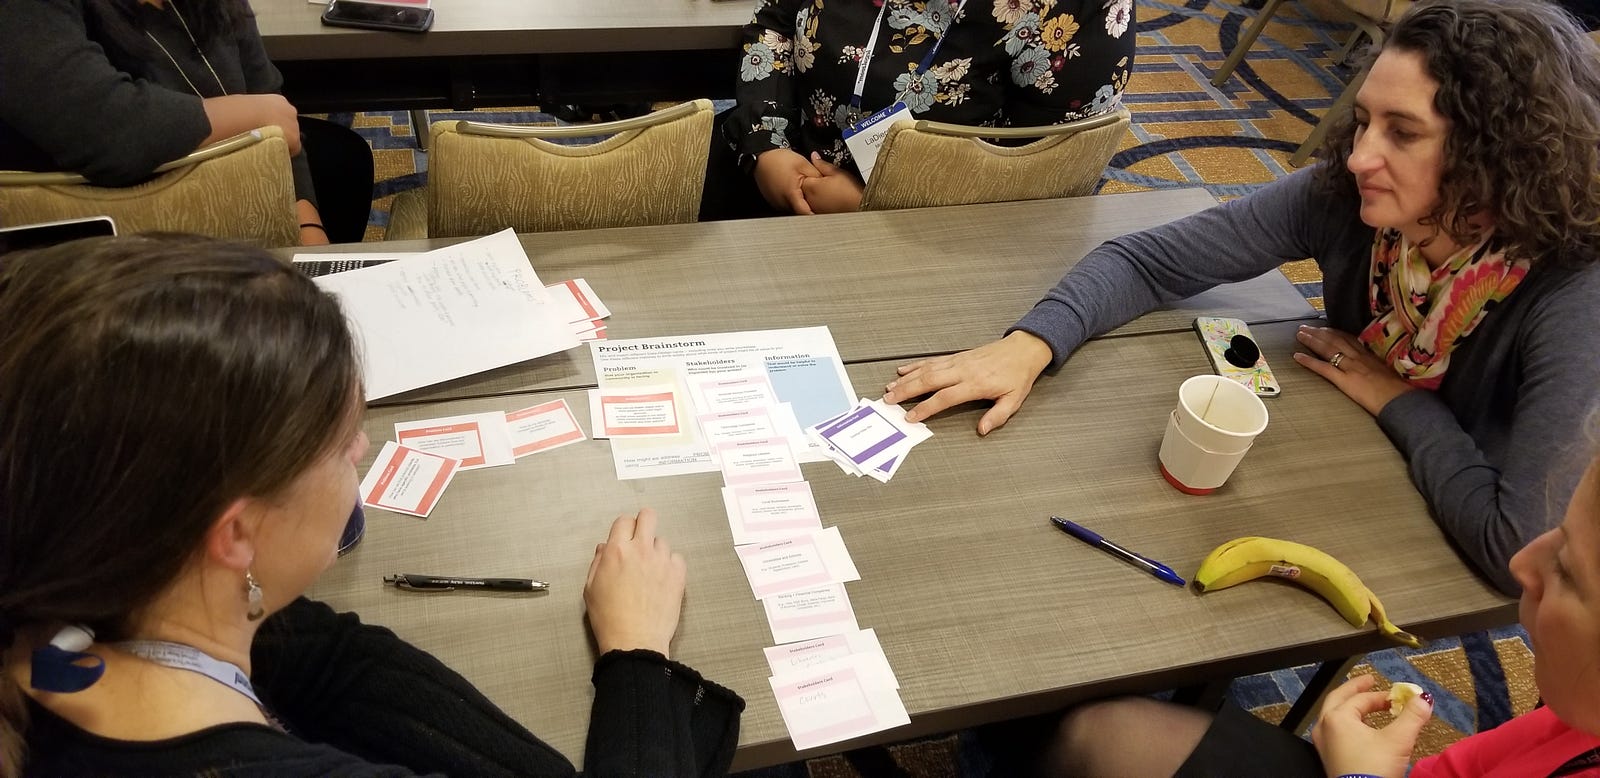
We used some of the structures of a design workshop — contained brainstorms, prompts and provocations, and templates as shared surfaces — to provide a guided backbone to the data project work.
We had a few main phases of work:
- Sharing out possible problem statements + central stakeholders.Before jumping to ‘data project’ proposals — first, what are some of the key problems around outreach, staffing, planning, triaging, funding, etc. that justice organizations are dealing with. Small teams listed them out, and we also gave a handful of common problems out on cards.
- Scouting information sources. Carlos had the insight that the word ‘data’ often intimidates lawyers and non-techies. So instead, we asked the groups to reflect on what kinds of information they had in their organizations, or that they had observed elsewhere. That includes administrative data, client notes, web analytics, emails and chats left by visitors, and more. We also gave out cards with data sources that we had pre-identified as possibly relevant.
- Brewing up possible data projects. From there, we gave the teams templates to then help structure mixing up information sources with stakeholders and problems, to then draft design project briefs. We also presented the teams with example case studies so they could see the templated/model version of other data projects as inspiration.
- Share-out + Partnerships. Our goal was to end the workshop with all the teams coming together to map out the data sources + project briefs they had brewed. Our goal was to improve the network ecosystem, of groups willing to share protocols, data, and inspiration with each other.
Issues + Breakdowns. At the end, we ran out of time for a full mapping and network discussion. It didn’t gel into a big wonderful payoff that we had hoped. And also, the groups were not very confident in their design proposals, so we found it hard to build partnerships when groups weren’t exactly sure what they wanted to work on.
Our templates gave some structure, but it wasn’t enough to brew a full data project vision. In the future, we need to do more work to get people oriented, equipped, and confident to think through discrete data design briefs.
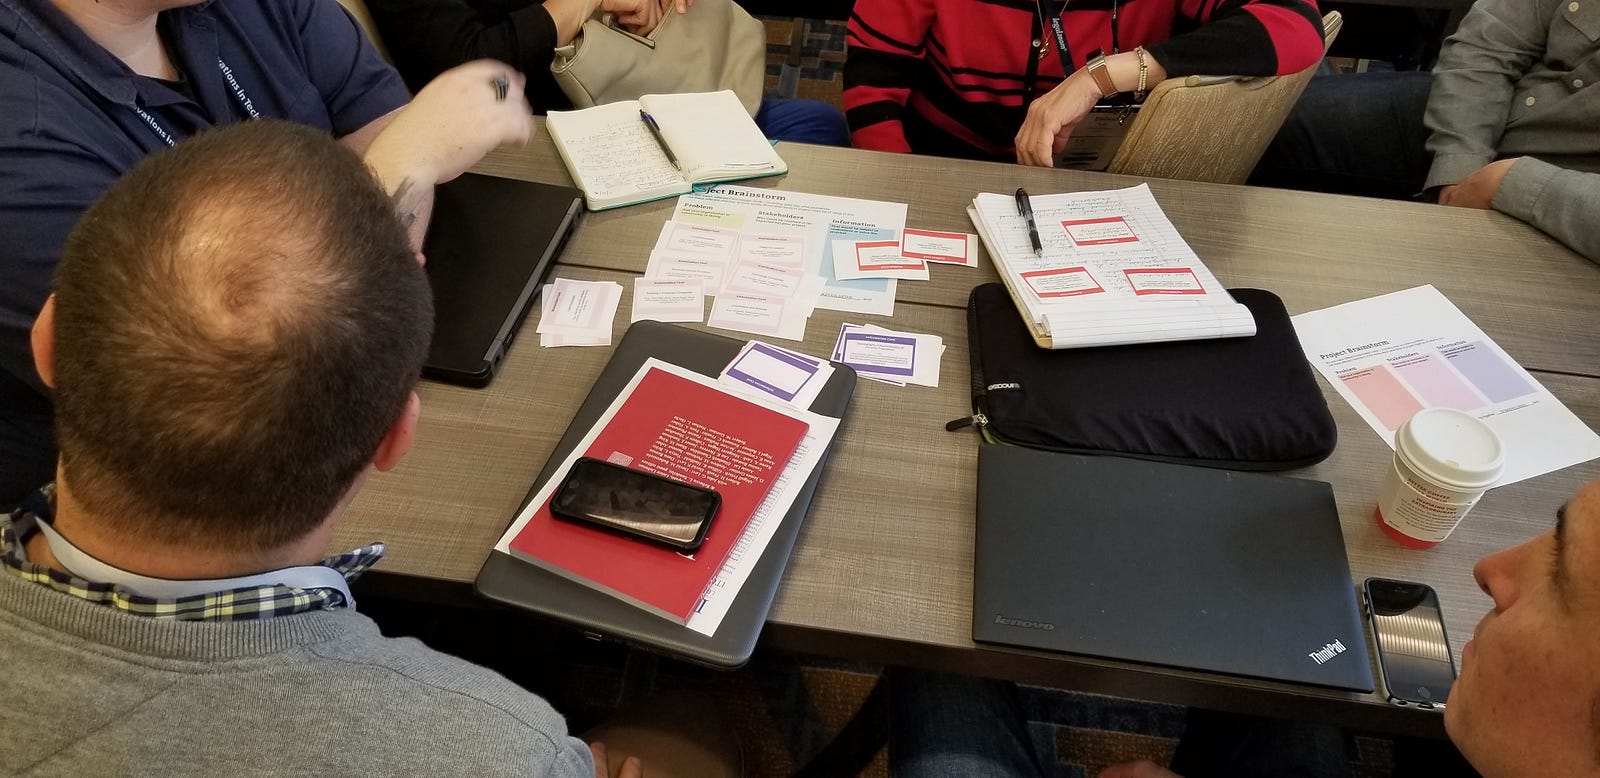
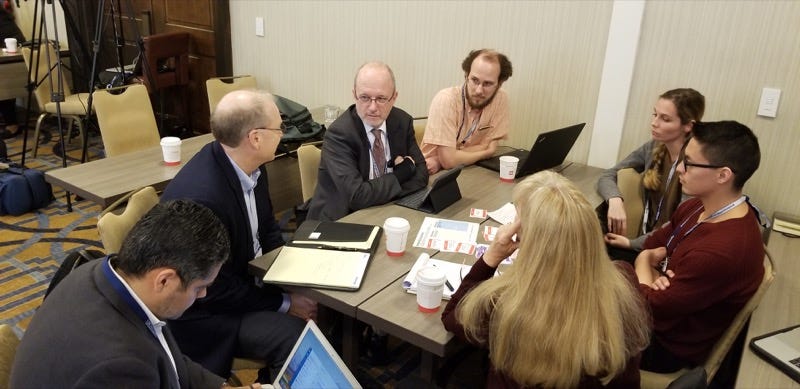
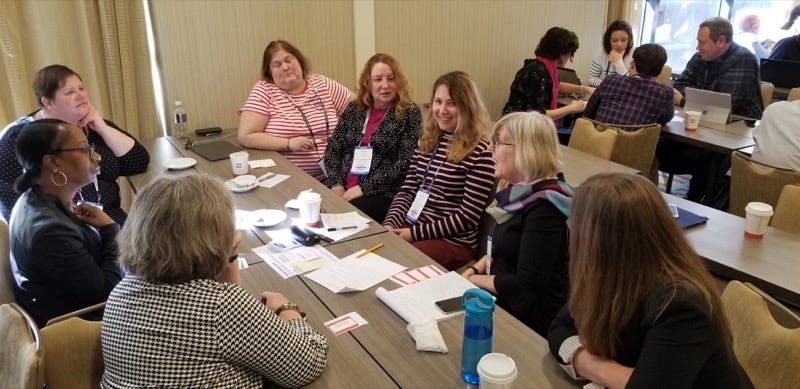
That said, it was a first stab at how to do this in a quick 1.5 hour window, and we learned a lot and got the discussion moving. Here is the workshop in pictures!
Resources
We created a page full of takeaway resources for people who want to improve their data skills and start exploring data projects. Here is all of that content for you too. Please share more things for us to include, in our next round of work!
1. Instructional Resources
To improve your data confidence & basic skills in cleaning, analyzing, and presenting
School of Data: Free, online https://schoolofdata.org/courses/
- Fundamentals
- Cleaning your data
- Exploring your data
- Extracting data from web sources (scraping) or from PDFs
- Mapping your data
- Using smartphones to collect data
- Visualize and present data, use in the media
- Working with budgets and spending data
2. Easy Access Data Tools
To explore + brainstorm with data that others have already made into tools/resources
- Census Poverty Data Tools — A listing of data tools developed by the US Census Bureau
- Debt in America — A map resource that allows you to explore the auto, student and medical debt crisis hotspots across the country.
- Eviction Lab — An interactive resource for mapping evictions at the local level.
- Justice Index — A comparative, multi-indicator index that measures access to justice at the state level.
- NACo County Explorer — Many different county level measures all in one place.
- Rental Housing Crisis — Interactive map with estimates of the affordable rental housing gap and federal assistance for extremely low-income (ELI) renter households at the county level.
3. Software Tools
To make sense of the data, explore it, map it, and visualize it
- QGIS — Open Source Geographic Information System for mapping.
- R — Open source statistical package. (Very powerful, steep learning curve.)
- Tabula -→ PDF to spreadsheet data (free & open source) , https://tabula.technology
- Tableau → spreadsheets to visualizations and dashboards — (Public tableau →free version, with all visualizations you create publicly viewable)
- Microsoft Power BI -→free data visualization tool for web presentation
4. Datasets
To use datasets that others have already prepared and cleaned
- Data.gov, including LSC’s datasets: https://catalog.data.gov/organization/legal-services-corporation
- Census datasets, including those in poverty, https://www.census.gov/topics/income-poverty/poverty/data/datasets.html
- National Archive of Criminal Justice Data,https://www.icpsr.umich.edu/icpsrweb/content/NACJD/index.html
- Justice Gap Survey Data https://www.lsc.gov/what-legal-aid/civil-legal-aid-data
5. Partners & Networks
To find collaborators and guidance from other groups
- Legal Services Corporation, Office of Data Governance and Analysis
- Law School Labs (https://www.legaldesignalliance.org/, Suffolk Lit Lab, BYU’s Law X, Stanford Legal Design Lab, Northeastern’s NuLaw Lab, Chicago-Kent Lab )
- Computational Policy Labs (Stanford’s Computational Policy Lab https://policylab.stanford.edu/, Regulation Lab)
- Legal Hackers
- National Neighborhood Indicators Partnership (affiliates)